All content on this site is intended for healthcare professionals only. By acknowledging this message and accessing the information on this website you are confirming that you are a healthcare professional. If you are a patient or carer, please visit the Lymphoma Coalition.
The Lymphoma Hub website uses a third-party service provided by Google that dynamically translates web content. Translations are machine generated, so may not be an exact or complete translation, and the Lymphoma Hub cannot guarantee the accuracy of translated content. The Lymphoma Hub and its employees will not be liable for any direct, indirect, or consequential damages (even if foreseeable) resulting from use of the Google Translate feature. For further support with Google Translate, visit Google Translate Help.


The Lymphoma & CLL Hub is an independent medical education platform, sponsored by AbbVie, BeOne Medicines, Miltenyi Biomedicine, Nurix Therapeutics, Roche, and Thermo Fisher Scientific and supported through independent educational grants from Bristol Myers Squibb, Incyte, Lilly, and Pfizer. Funders are allowed no direct influence on our content. The levels of sponsorship listed are reflective of the amount of funding given. View funders.
Now you can support HCPs in making informed decisions for their patients
Your contribution helps us continuously deliver expertly curated content to HCPs worldwide. You will also have the opportunity to make a content suggestion for consideration and receive updates on the impact contributions are making to our content.
Find out more
Create an account to access:
Bookmark & personalize site content
Receive alerts for new content in your areas of interest
View lymphoma & CLL content recommended for you
ctDNA serves as a prognostic marker throughout induction therapy in patients with previously untreated MCL
Do you know... In a phase II study evaluating bortezomib monotherapy followed by DA-EPOCH-R plus bortezomib induction, and subsequent bortezomib maintenance vs observation, investigators sought to identify the prognostic value of ctDNA encoding immunoglobulin receptor sequences. Which of the following clinical characteristics was not associated with elevated baseline ctDNA in this study?
The treatment and management approaches to mantle cell lymphoma (MCL) vary considerably between patients due to disease heterogeneity. Herein lies a need for suitable predictive biomarkers to allow for personalized clinical management in the MCL setting. High-risk subgroups can be identified using tissue-based assays and genetic evaluation; however, more precise tools are required to further optimize treatment personalization.
Generally, patients undergo induction therapy followed by autologous stem cell transplant (auto-SCT) and subsequent rituximab maintenance, but high relapse rates persist, highlighting that this approach is not effective nor suitable for all patients. The addition of bortezomib to rituximab and CAP (cyclophosphamide, doxorubicin, and prednisone; VR-CAP), has demonstrated improved survival and response rates over R-CHOP (rituximab, cyclophosphamide, doxorubicin hydrochloride, vincristine, and prednisone) in patients who don’t proceed to auto-SCT. Taken together, this suggests that certain patients with MCL have disease sensitivity to bortezomib, whilst others do not.
Detection of chromosomal translocation t(11;14) by polymerase chain reaction as a marker of measurable residual disease (MRD) has been associated with clinical outcomes in patients with MCL undergoing auto-SCT. However, there remains little data around the value of MRD as a prognostic indicator for induction therapy.
Circulating tumor DNA (ctDNA) can be detected using next-generation sequencing and studies have reported its prognostic value in patients with DLBCL, but there are speculations that this will translate to the MCL setting. Lakhotia, et al., reported on a phase II study (NCT00114738) investigating bortezomib monotherapy with subsequent bortezomib and DA-EPOCH-R (dose-adjusted etoposide, prednisone, vincristine, cyclophosphamide, doxorubicin, and rituximab) induction in patients with treatment-naïve MCL. The study sought to evaluate the value of bortezomib maintenance vs observation in patients who achieved a partial response to initial therapy, with a focus on the significance of ctDNA dynamics as a predictor of clinical outcomes.
Study design
In total, 53 patients aged ≥18 years with ECOG Performance Status ≤3 and acceptable organ function were identified and enrolled (Figure 1). Patients were excluded if they had human immunodeficiency virus, central nervous system involvement, peripheral neuropathy ≥Grade 2, or were pregnant.
Figure 1. Consort diagram*
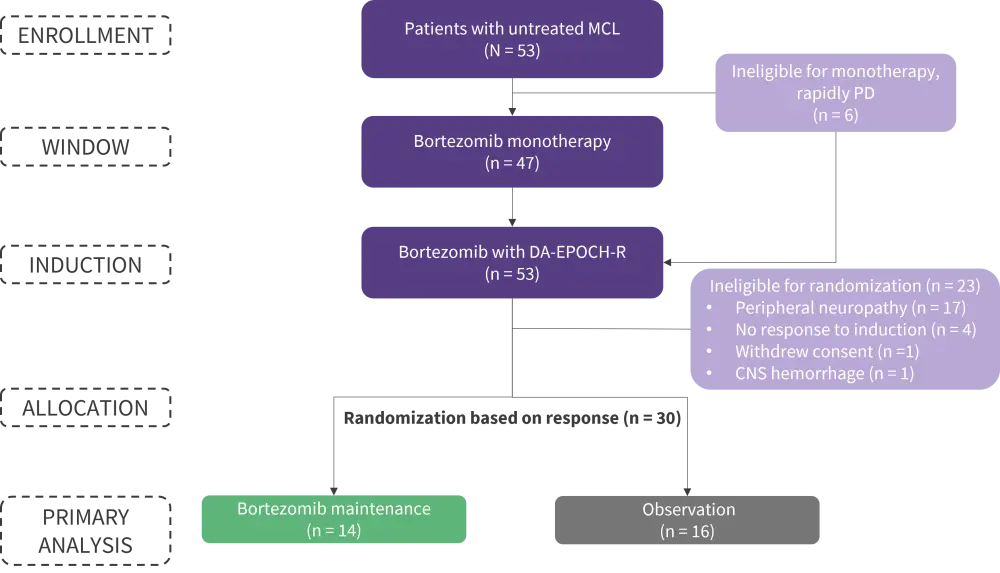
CNS, central nervous system; DA-EPOCH-R, dose-adjusted etoposide, prednisone, vincristine, cyclophosphamide, doxorubicin, and rituximab; MCL, mantle-cell lymphoma; PD, progressive disease.
*Adapted from Lakhotia, et al.1
Patients underwent treatment with bortezomib monotherapy followed by DA-EPOCH-R plus bortezomib induction, and either bortezomib maintenance or observation in three distinct treatment categories as shown in Figure 2.
ctDNA encoding immunoglobulin receptor sequences was assessed using next-generation sequencing on patient serum samples and evaluated as markers of MRD (Figure 2). The study sought to determine the association, if any, between the presence and quantity of serum ctDNA and patient outcomes to therapy in the frontline MCL setting.
Figure 2. Treatment schema *
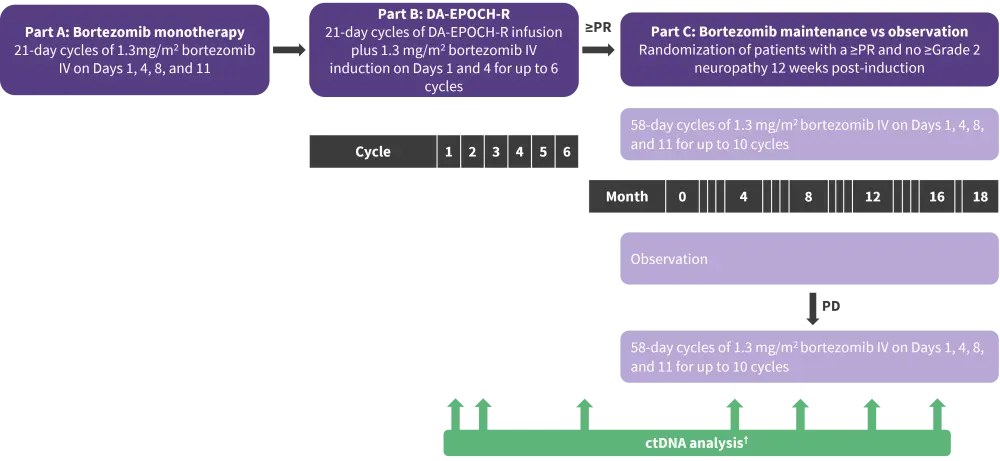
DA-EPOCH-R, dose-adjusted etoposide, prednisone, vincristine, cyclophosphamide, doxorubicin, and rituximab; IV, intravenous; PD, progressive disease; PR, partial response.
*Adapted from Lakhotia, et al.1
†Research samples including serum for ctDNA were collected at protocol-defined timepoints including pretreatment, after the bortezomib window, after cycles one and two of induction therapy, at the end of induction, and at each follow-up visit.
Results
Patient baseline characteristics are shown in Table 1.
Table 1. Baseline patient characteristics by maintenance approach*
|
BM, bone marrow; GI, gastrointestinal; LDH, lactate dehydrogenase; MIPI, mantle cell lymphoma international prognostic index; PB, peripheral blood. |
||||
|
Characteristic, % (unless otherwise stated) |
All |
Bortezomib |
Observation |
Not randomized |
|---|---|---|---|---|
|
Median age (range), years |
59 (41–75) |
54 (42–73) |
58 (43–72) |
63 (46–76) |
|
Male |
77 |
86 |
81 |
70 |
|
MIPI risk |
|
|
|
|
|
Low |
47 |
57 |
50 |
39 |
|
Intermediate |
36 |
36 |
44 |
30 |
|
High |
17 |
7 |
6 |
30 |
|
Elevated LDH |
40 |
36 |
38 |
43 |
|
Non-nodal disease |
13 |
14 |
13 |
13 |
|
Extranodal |
|
|
|
|
|
PB |
100 |
100 |
100 |
100 |
|
BM |
96 |
100 |
94 |
96 |
|
GI |
77 |
78 |
88 |
68 |
|
Histological subtype |
|
|
|
|
|
Blastoid |
13 |
7 |
12 |
17 |
|
Classic |
87 |
93 |
88 |
83 |
|
Ki-67 status |
|
|
|
|
|
<10% |
27 |
18 |
25 |
33 |
|
10–29% |
52 |
64 |
42 |
52 |
|
≥30% |
20 |
18 |
33 |
14 |
|
Missing |
9 |
3 |
4 |
2 |
Efficacy
- Of the patients that received bortezomib in part A (n = 47), computed tomography identified measurable disease in 39 which decreased in 64% of patients after initial treatment; bortezomib induced partial response in 4 patients.
- Most patients (96%) finished the six planned cycles of bortezomib, while 57% continued to randomization (Figure 1).
- Of the patients in the bortezomib maintenance vs observation arms, 86% and 100% were in complete response (CR) following induction therapy, respectively.
- At 12.7 years, neither progression-free survival (PFS) nor overall survival rates differed significantly between patients who received bortezomib maintenance and those who underwent observation or did not receive bortezomib maintenance (Table 2).
Table 2. Survival outcomes in patients receiving bortezomib maintenance vs observation/not randomized*
|
OS, overall survival; PFS, progression-free survival. |
||
|
Treatment |
PFS (95% CI), years |
OS (95% CI), years |
|---|---|---|
|
All patients (N = 53) |
2.4 (1.6–2.9) |
10.9 (6.9–NE) |
|
Randomized patients (n = 30) |
|
|
|
Bortezomib maintenance (n = 14) |
2.3 (1–4.1) |
10.9 years (3.4–NE) |
|
Observation (n = 16) |
2.6 (1.6–7.6) |
NR |
|
p value |
0.39 |
0.32 |
|
Not randomized or observation (n = 34) |
2.8 (1.7–3.9) |
13.8 (7.4–13.8) |
|
p value† |
0.58 |
0.42 |
Safety
- Significant hematologic events included Grade ≥3 neutropenia and thrombocytopenia in 56% and 35% of cycles, respectively; 40% of patients experienced ≥1 episode of febrile neutropenia.
- Neuropathy was the most critical non-hematologic adverse event but was largely manageable.
- Grade ≥2: 53% of patients; 14% of patients improved to Grade 1, and neuropathy was resolved successfully in and a further 14%
- Grade ≥3: 15% of patients
- Bortezomib and vincristine dose reductions were necessary in 33% and 45% of patients, respectively, and neuropathy led to discontinuation of both agents in 13% of patients.
- Grade 2 neuropathy and elevated creatinine resulted in bortezomib discontinuation in 4% of patients.
Pre-treatment ctDNA and prognosis
- Of the patients enrolled in this study, 50 had pre-treatment tissue samples available with ≥1 tumor clonotype utilizable for MRD evaluation (Figure 2).
- IGH: 100% of patients
- IGK: 64% of patients
- IGL: 42% of patients
- At baseline, 98% of evaluable patients had detectable ctDNA (median concentration, 743 lymphoma molecules per mL; range, 0–1 × 10⁵).
- Blastoid histology, high-risk MIPI score, Ki67 ≥30%, and non-nodal disease were associated with elevated ctDNA levels (Table 3).
- Regarding baseline FDG-PET scans, pre-treatment ctDNA was significantly associated with total metabolic tumor volume and whole-body total lesion glycolysis (p < 0.0001).
- PFS and overall survival did not differ significantly between patients with pre-induction concentrations of ctDNA above the median ‘high’ and below the median ‘low’ thresholds. This altered when ctDNA was considered as a continuous variable and shorter PFS was attributed to higher levels of baseline ctDNA.
Table 3. ctDNA level by clinical presentation*
|
MIPI, mantle cell lymphoma international prognostic index. *Data from Lakhotia, et al.1 |
|
|
Clinical observation |
Median ctDNA concentration, lymphoma molecules per mL |
|---|---|
|
Histology |
|
|
Blastoid |
4392.2 |
|
Classical |
427.5 |
|
p value |
0.0025 |
|
MIPI risk group |
|
|
Low |
143.1 |
|
Intermediate |
1419.1 |
|
High |
6518.9 |
|
p value |
0.0094 (global) |
|
Ki67 |
|
|
Ki67 <10% |
77.5 |
|
Ki67 10–29% |
453.1 |
|
Ki67 ≥30% |
1529.1 |
|
p value |
0.33 |
|
Extra-nodal involvement |
|
|
Non-nodal disease |
6076.5 |
|
Nodal disease |
540.0 |
|
p value |
0.04 |
ctDNA and induction therapy
- Following bortezomib monotherapy, a median change of −30% ctDNA (range, −100% to +531% ctDNA) was observed in the 41 evaluable patients, with 63% demonstrating a decrease in ctDNA levels.
- A ≥50% decrease in ctDNA from baseline was reported in 15 patients. When compared with patients who achieved <50% decrease, PFS did not differ significantly.
- Figure 3 represents the shift in detectable serum ctDNA levels in 50 evaluable patients over the course of therapy.
- Of the patients who achieved a CR (84%), 7% had detectable ctDNA following induction therapy.
- Of the eight patients who achieved <CR (16%), 88% had detectable ctDNA, and ctDNA analysis detected immunoglobulin sequences in eight and seven of these patients following one and two cycles of therapy, respectively.
- These findings support the predictive value of early ctDNA monitoring regarding outcomes/resistance to induction in MCL.
Figure 3. ctDNA levels at different timepoints of induction therapy*
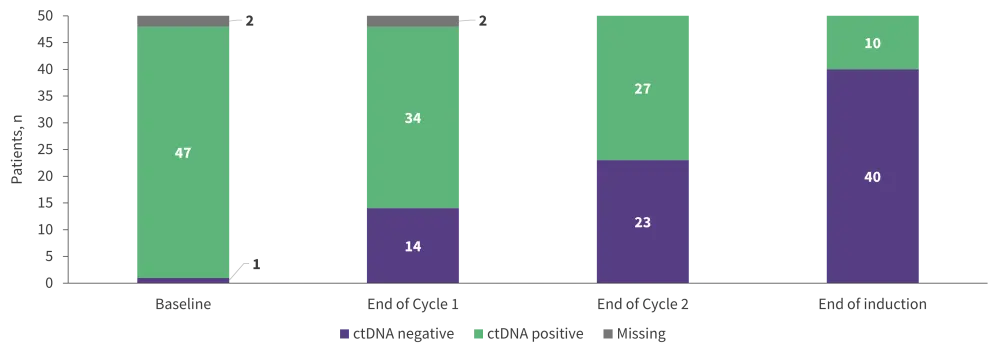
ctDNA, circulating tumor deoxyribose nucleic acid.
*Data from Lakhotia, et al.1
Survival outcomes were superior in patients with undetectable vs detectable ctDNA at different stages of induction therapy (Table 4).
Table 4. PFS and OS by presence of ctDNA at different points of induction therapy*
|
ctDNA, circulating tumor deoxyribose nucleic acid; NE, not estimated; OS, overall survival; PFS, progression-free survival. |
||
|
Therapeutic landmark |
PFS (95% CI), years |
OS (95% CI), years |
|---|---|---|
|
First cycle of induction |
|
|
|
Detectable ctDNA |
1.7 (1.2–2.5) |
7.6 (5.8–2.4) |
|
No detectable ctDNA |
7.3 (2.9–NE) |
13.8 (5.5–13.8) |
|
p value |
0.002 |
0.07 |
|
First two cycles of induction |
|
|
|
Detectable ctDNA |
1.8 (1.2–2.9) |
7.4 (5.1–10.9) |
|
No detectable ctDNA |
2.7 (1.7–8.1) |
13.8 (5.8–NE) |
|
p value |
0.005 |
0.03 |
|
End of induction |
|
|
|
Detectable ctDNA |
1.5 (0.4–2.0) |
3.9 (0.4–NE) |
|
No detectable ctDNA |
2.6 (1.7–3.9) |
12.4 (7.6–NE) |
|
p value |
0.003 |
0.02 |
ctDNA and risk stratification
In patients with both low-risk MIPI scores and low (<10%) Ki-67 proliferation index, undetectable ctDNA after one and two cycles of induction therapy was associated with longer PFS compared to patients with detectable ctDNA. This did not translate to patients with intermediate-/high-risk MIPI scores/Ki67 indices.
ctDNA and early relapse
- Of the 40 patients who had no detectable ctDNA post-induction and proceeded to part C, 15% were progression-free 9 years after induction (observation, n = 3; maintenance, n = 2; not randomized, n = 1).
- Significantly higher pre-treatment median ctDNA levels were observed in patients who experienced long-term progression vs those who did not (p = 0.013).
- Overall, 72% of patients who did not have detectable ctDNA by the end of induction experienced relapse within a median of 12.8 months, of which 62% demonstrated detectable ctDNA in line with radiologic progression at a median lead time of 7.2 months.
- ctDNA remained undetectable in 38% of patients but radiologic progression was detected.
Conclusion
In patients with previously untreated MCL, bortezomib maintenance did not offer improved survival outcomes over observation in patients who received prior treatment with bortezomib monotherapy followed by DA-EPOCH-R and bortezomib induction. Peripheral blood was used to identify tumor-specific clonotypes through ctDNA analysis in patients with MCL, and pre-treatment ctDNA was prognostic in this study. Throughout treatment, early clearance of ctDNA was associated with superior survival and clinical outcomes in patients with previously untreated MCL.
The author notes the following limitations with the study presented and methods used:
- Small sample size.
- Conventional chemotherapy in combination with a targeted agent was evaluated and used in this study to determine the value of ctDNA as a prognostic marker, which may change as induction therapies evolve.
- Serum samples were the only source of ctDNA in this study, ruling out the potential of peripheral blood mononuclear cells or plasma. An alternative study highlighted the benefit of plasma over other analytes for ctDNA in patients with DLBCL but was determined after the onset of the presented study.
- The choice of assay used to evaluate ctDNA in this study necessitates a high disease burden sample to detect tumor clonotypes which may not be feasible moving forward.
- Sample quality may impact tumor clonotype identification in older samples.
References
Please indicate your level of agreement with the following statements:
The content was clear and easy to understand
The content addressed the learning objectives
The content was relevant to my practice
I will change my clinical practice as a result of this content
Your opinion matters
What is the primary reason you use bridging therapy in patients with DLBCL awaiting CAR T-cell therapy?